The graph shows the pressure changes in three structures of the right side of the heart during the cardiac cycle.
What is represented by the line labelled T?
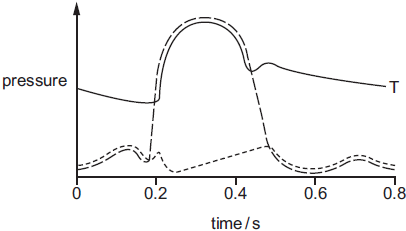
pressure changes in the pulmonary artery
2 )
pressure changes in the right atrium
3 )
pressure changes in the right ventricle
4 )
pressure changes in the vena cava
تحلیل ویدئویی تست
منتظریم اولین نفر تحلیلش کنه!


پرسش و پاسخ های مشابه
سوال کنید یا به سوالات دیگران پاسخ دهید ...