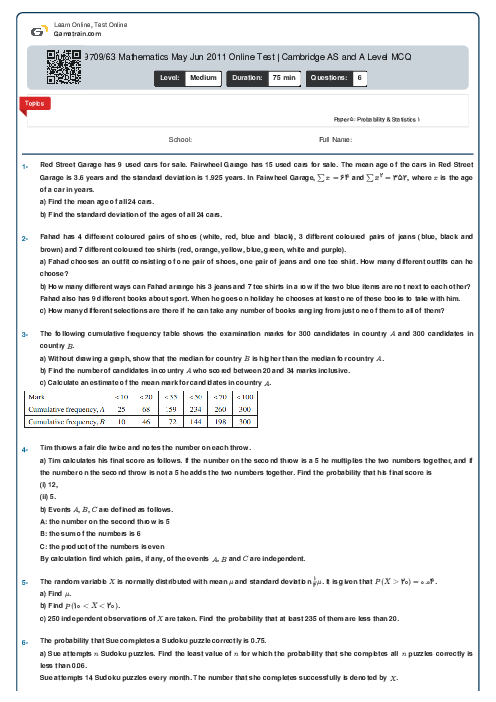
9709/63 Mathematics May Jun 2011 Online Test | Cambridge AS and A Level MCQ
Cambridge
AS & A Level
Mathematics (9709)
شهریور
2011
مشاهده نمونه سوال
شامل مباحث:
Paper 5: Probability & Statistics 1
تعداد سوالات: 6
سطح دشواری:
متوسط
شروع:
آزاد
پایان:
آزاد
مدت پاسخگویی:
75 دقیقه
رایگان
لطفا برای اطمینان از عملکرد و تجربه بهتر از مرورگرهای مدرن و به روز مانند کروم یا فایرفاکس استفاده کنید.
پیش نمایش صفحه اول فایل
 Danial Naderi
 There are 5000 schools in a certain country. The cumulative frequency table shows the number of pupils in a school and the corresponding number of schools.
a) Draw a cumulative frequency graph with a scale of $2{\text{ }}cm$ to 100 pupils on the horizontal axis and a scale of $2{\text{ }}cm$ to 1000 schools on the vertical axis. Use your graph to estimate the median number of pupils in a school.
b) 80% of the schools have more than $n$ pupils. Estimate…


محتواهای آموزشی مشابه
فایل های پاورپوینت، ویدئو، صوتی، متنی و ...
پرسش و پاسخ های مشابه
سوال کنید یا به سوالات دیگران پاسخ دهید ...