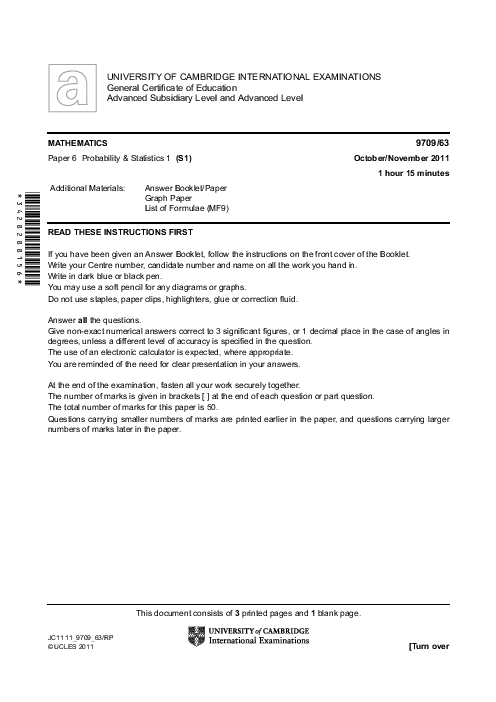
Paper 6 October/November 2010 MATHEMATICS (9709/63) A Levels
لطفا برای اطمینان از عملکرد و تجربه بهتر از مرورگرهای مدرن و به روز مانند کروم یا فایرفاکس استفاده کنید.
Fahad has 4 different coloured pairs of shoes (white, red, blue and black), 3 different coloured pairs of jeans (blue, black and brown) and 7 different coloured tee shirts (red, orange, yellow, blue, green, white and purple).
a) Fahad chooses an outfit consisting of one pair of shoes, one pair of jeans and one tee shirt. How many different outfits can he choose?
b) How many different ways can Fahad arrange his 3 jeans and 7 tee shirts in a row if the…

