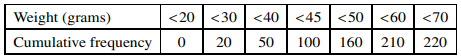
The weights of 220 sausages are summarised in the following table.
a) State which interval the median weight lies in.
b) Find the smallest possible value and the largest possible value for the interquartile range.
c) State how many sausages weighed between $50{\text{ }}g$ and $60{\text{ }}g$.
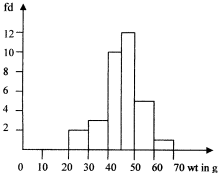
d) On graph paper, draw a histogram to represent the weights of the sausages.
پاسخ تشریحی :
تحلیل ویدئویی تست
منتظریم اولین نفر تحلیلش کنه!

محتواهای آموزشی مشابه
فایل های پاورپوینت، ویدئو، صوتی، متنی و ...
پرسش و پاسخ های مشابه
سوال کنید یا به سوالات دیگران پاسخ دهید ...