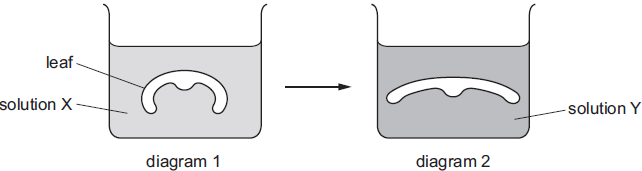
Diagram 1 and diagram 2 show how the transverse section through a leaf changes when the leaf is moved from solution X to solution Y.
Which row describes the water potential of the leaf cells and surrounding solutions in diagram 2 compared with diagram 1?
water potential of leaf cells in diagram 2 compared with water potential of leaf cells in diagram 1 (less negative) water potential of solution Y compared with water potential of solution X (less negative)
2 )
water potential of leaf cells in diagram 2 compared with water potential of leaf cells in diagram 1 (less negative) water potential of solution Y compared with water potential of solution X (more negative)
3 )
water potential of leaf cells in diagram 2 compared with water potential of leaf cells in diagram 1 (more negative) water potential of solution Y compared with water potential of solution X (less negative)
4 )
water potential of leaf cells in diagram 2 compared with water potential of leaf cells in diagram 1 (more negative) water potential of solution Y compared with water potential of solution X (more negative)
تحلیل ویدئویی تست
تحلیل ویدئویی برای این تست ثبت نشده است!