A quantity of an enzyme was added to a quantity of its substrate. The graphs show the changes in concentration of the enzyme, the substrate, the enzyme-substrate complex and the product over time.
Which graph shows the change in the concentration of the enzyme-substrate complex?
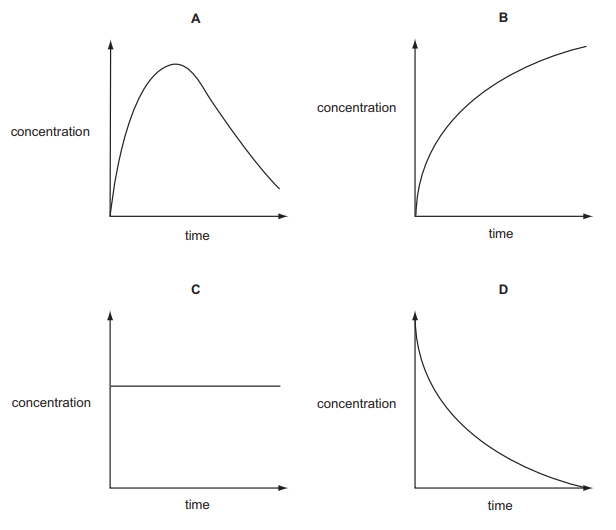
A
2 )
B
3 )
C
4 )
D
تحلیل ویدئویی تست
تحلیل ویدئویی برای این تست ثبت نشده است!


پرسش و پاسخ های مشابه
سوال کنید یا به سوالات دیگران پاسخ دهید ...