The diagram below shows a breakeven chart.
The business produces and sells 10 million units of output. Price rises from £5 to £9.
As a result, profit changes:
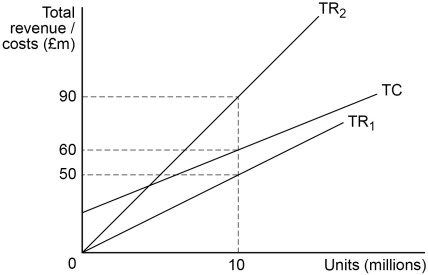
from minus £10m to £30m.
2 )
from minus £10m to £40m.
3 )
from £10m to £30m.
4 )
from £10m to £40m.
تحلیل ویدئویی تست
منتظریم اولین نفر تحلیلش کنه!


پرسش و پاسخ های مشابه
سوال کنید یا به سوالات دیگران پاسخ دهید ...