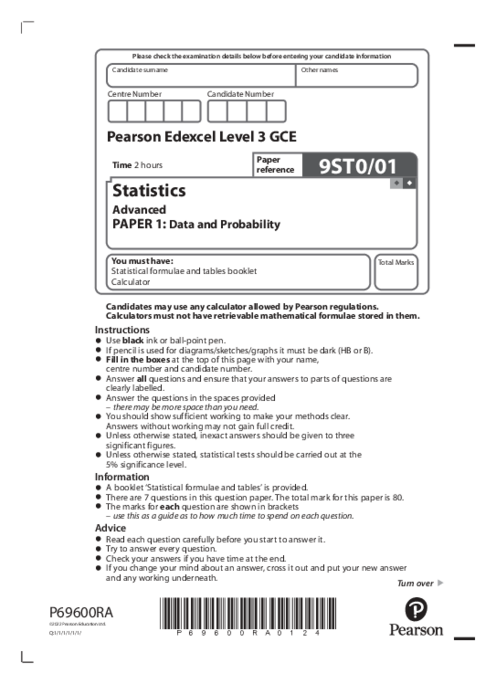
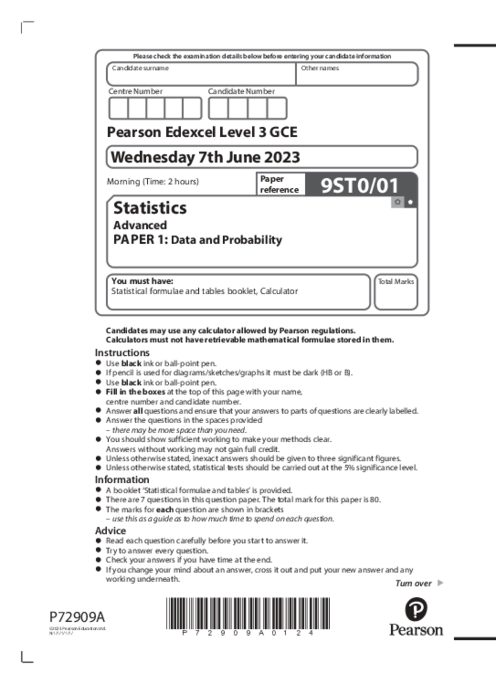
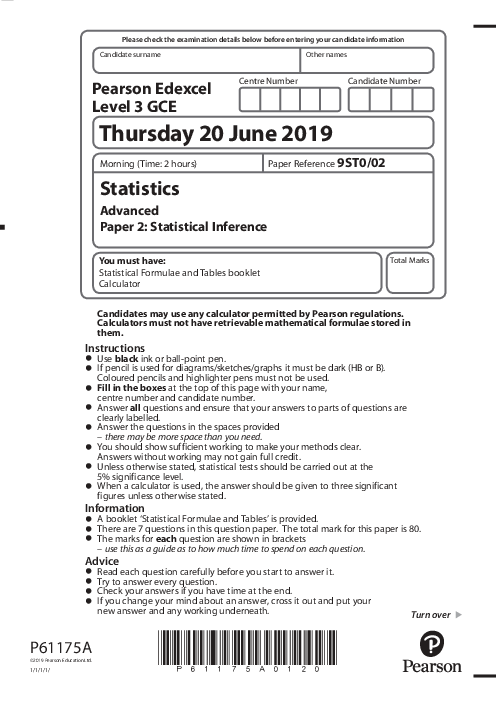
Statistics 9ST0/01 June 2019 | Edexcel A Level Past Papers With Mark Scheme
Edexcel
A Level
Statistics (9ST0)
Jun
2019
2. Continuous random variable modeling—triangular and uniform distributions, probability density functions, symmetry-based median and mean equality, probability calculation over intervals, conditional probabilities, algebraic derivation from graphical models
3. Sampling techniques—stratified, random, opportunity, bias consideration, quota method description, strengths and weaknesses of internet surveys, representativeness, control over population subgroups
4. Hypothesis testing—binomial and normal approximations, significance levels, test statistics computation, interpretation of p-values, population proportion comparison, assumptions of random sampling and normality
5. Data representation and correlation—scatter plots and outlier identification, effect on correlation coefficient, Pearson vs. Spearman correlation methods, ranking-based non-parametric alternatives, data transformation for linearization
6. Government dataset evaluation—categorical data in contingency tables, chi-squared test for independence, expected frequency calculations, implications of sample vs. population values, real-world interpretation of association between social and demographic variables
معلم موافق رایگان بودن است.
1. Population and sample distinction—definition and classification of statistics vs. parameters, formulaic expressions for data analysis, summation notation interpretation, sample variance components2. Continuous random variable modeling—triangular and uniform distributions, probability density functions, symmetry-based median and mean equality, probability calculation over intervals, conditional probabilities, algebraic derivation from graphical models
3. Sampling techniques—stratified, random, opportunity, bias consideration, quota method description, strengths and weaknesses of internet surveys, representativeness, control over population subgroups
4. Hypothesis testing—binomial and normal approximations, significance levels, test statistics computation, interpretation of p-values, population proportion comparison, assumptions of random sampling and normality
5. Data representation and correlation—scatter plots and outlier identification, effect on correlation coefficient, Pearson vs. Spearman correlation methods, ranking-based non-parametric alternatives, data transformation for linearization
6. Government dataset evaluation—categorical data in contingency tables, chi-squared test for independence, expected frequency calculations, implications of sample vs. population values, real-world interpretation of association between social and demographic variables
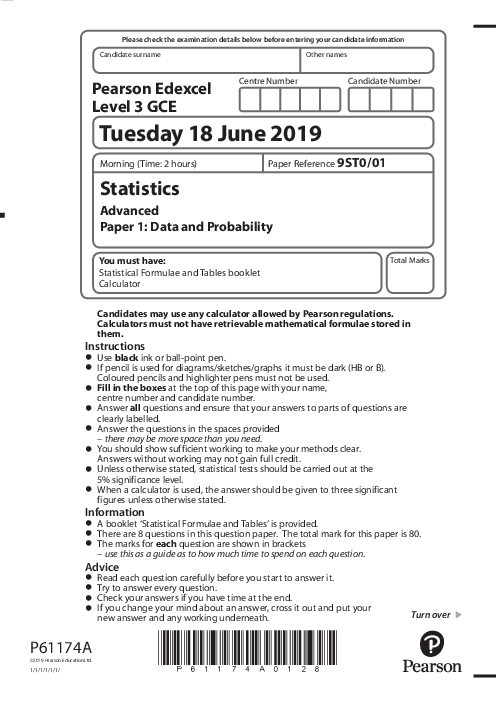
پیش نمایش صفحه اول فایل
تعداد صفحات فایل : 28
باز نشر محتواها در فضای مجازی، ممنوع است.

